AI Didn’t Break Kubernetes Optimization. GPUs Did.
The industry is buzzing about how AI agents have driven up Kubernetes costs. But most agents run like any other service, and the usual tools like right-sizing, bin packing and autoscaling still work on them. For teams hosting their own model inference, the real change is more specific and far The post AI Didn’t Break Kubernetes Optimization. GPUs Did. appeared first on Cloud Native Now .
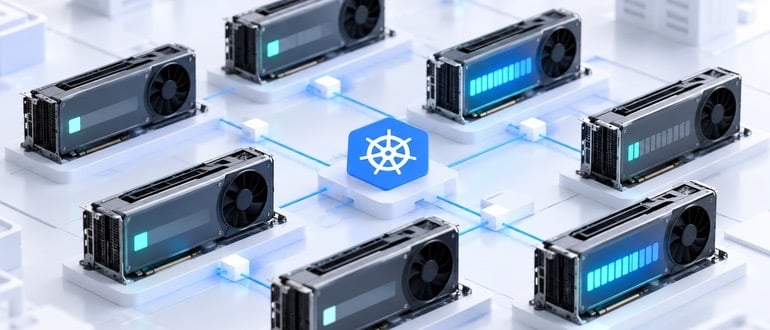
The AI industry is currently focused on how artificial intelligence agents have increased Kubernetes costs. However, most agents operate like any other service, and traditional tools such as right-sizing, bin packing, and autoscaling are still effective. The true change lies in the use of GPUs, which are significantly more expensive and can be wasteful if not managed properly.
By default, Kubernetes allocates entire GPUs when requesting one, even if the workload only needs a fraction of its computing power. Many inference workloads behave this way, utilizing a small percentage of the GPU's capabilities. While MIG (Multi-Instance GPUs) and Dynamic Resource Allocation can partition GPUs into smaller instances for more flexible resource management, adoption of these technologies remains uneven.
Teams often provision for peak usage that never materializes. GPUs are the most expensive hardware in the stack, and frequently they are underutilized. Conventional monitoring may not detect this as an issue, as healthy pods and good-looking dashboards mask the underlying problem. The cost appears on the same node group as other resources, making it difficult to identify GPU-related expenses.
Sharing GPUs through time-slicing, configured via NVIDIA device plugin or GPU Operator, allows multiple jobs to take turns using a single GPU, each believing it owns the entire resource. However, this approach has two underestimated costs. First, there is an overhead of compute due to context switching between jobs, which consumes actual work time.
Second, time-slicing provides no memory isolation, leading to competition for the same memory pool among jobs. A job that experiences a spike can exhaust the memory needed by other workloads, resulting in out-of-memory errors that affect multiple shared GPU jobs.
This situation can be misleading, as inference servers exhibiting such behavior may appear on par with a server at full load, even if the latter is idle. Continuous batching, as implemented in engines like vLLM, further complicates the situation by making it challenging to distinguish useful work from inefficiencies when relying on node-level metrics alone.
Provisioning for peak workloads without corresponding demand can lead to overprovisioning of GPU resources, which may not be evident through conventional metrics. Instead, metrics such as queue depth – the number of requests waiting to be served – located within the serving engine's metrics, can provide a more accurate reflection of actual load. It is crucial to not solely rely on node-level memory or compute metrics to gauge GPU utilization.
Begin by scrutinizing queue depth and other serving metrics within the serving engine rather than solely focusing on node-level data. This will enable better-informed autoscaling decisions. Moreover, it is advisable to avoid sharing GPUs among spiky, memory-hungry jobs, as time-slicing does not protect them from each other's memory usage.
For workloads that genuinely require shared GPUs, hardware partitioning (MIG on supported NVIDIA hardware) offers memory isolation that time-slicing cannot provide. Although it reduces flexibility due to predefined partition sizes, it transforms a noisy neighbor risk into a capacity planning decision.
Lastly, focus on the easy wins first by identifying workloads that consume minimal GPU compute but occupy an entire GPU. Treat GPUs as any other expensive shared resource and closely monitor their usage. The AI infrastructure focus has been primarily on models, with comparatively little attention paid to monitoring the hardware that runs them.
On many Kubernetes bills, GPUs constitute the largest line item and offer the least instrumentation. By examining GPUs in the right places – often within the serving engine – waste can be identified and minimized.
Written by urgent.news from Container Journal's reporting — not their text. Machine-written — may contain errors; check the original before relying on it.