Mapping Childhood Lead Exposure Risk in the United States, Neighborhood by Neighborhood
A researcher uses housing and poverty data to identify locations where children are more likely to be exposed to lead.
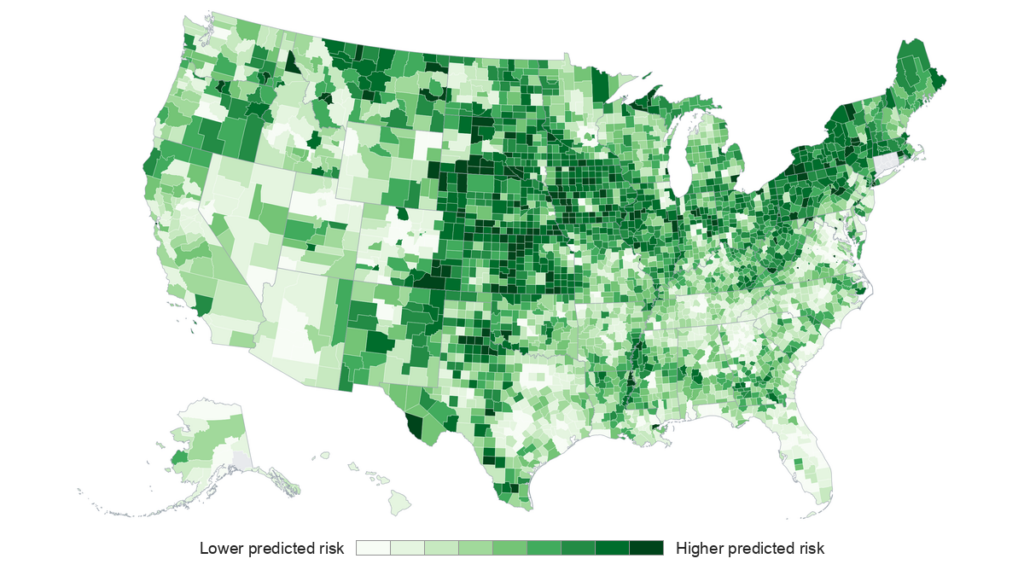
Childhood exposure to lead has no safe threshold, with even minimal blood lead levels causing serious health issues and developmental delays. Yet, comprehensive neighborhood-level data on lead exposure in the United States are limited, leaving significant gaps in understanding where such exposure may occur. Lead paint, which was banned for home use in 1978, is likely a major contributor to lead exposure, particularly in older neighborhoods and those with higher poverty rates.
Communities with lower incomes tend to have fewer resources for lead remediation, exacerbating the problem.
Researchers at Fluoro-Spec, a lead testing company, used existing EPA research that suggests a community's housing stock age and poverty level are good predictors of childhood lead exposure. Using this framework, they developed a risk score that covers all 83,388 U.S. census tracts and 3,222 counties, enabling a nationwide screening tool to identify areas with higher lead exposure risks. This tool builds upon previous research and incorporates data from the 2018–2022 American Community Survey.
To validate the effectiveness of the risk map, researchers compared the predicted lead risk scores with actual blood lead levels in children from 11 states: Illinois, Iowa, Massachusetts, Michigan, Minnesota, Missouri, New Jersey, New York, Ohio, Rhode Island, and Wisconsin. Data sources for the validation included both census tract and county levels.
The results showed a consistent positive correlation between predicted risk and measured blood lead levels across all states, including Michigan and Ohio, which served as consistency checks due to the earlier EPA research.
Wisconsin showed the strongest correlation among states with census tract-level data (0.64), while Minnesota had the weakest correlation (0.43). Among counties, New Jersey demonstrated the strongest correlation (0.77), whereas New York had the weakest (0.48). The map serves as a screening tool to pinpoint neighborhoods where lead exposure may be more likely, aiding in the allocation of resources for blood testing, home inspections, and outreach efforts.
While the map cannot determine if a specific home is safe from lead, it can help guide future interventions to protect children from the harmful effects of lead exposure.
Written by urgent.news from Eos's reporting — not their text. Machine-written — may contain errors; check the original before relying on it.