Energy and Carbon Emissions: Some Global Ground Truths
Amidst all the policy proposals, claims, and counterclaims about energy use and carbon emissions, it’s useful to touch base from time to time with basic current facts. One of my starting points is the Statistical Review of World Energy, published annually (free registration needed to download the report). The report is full of figures and … Continue reading Energy and Carbon Emissions: Some…
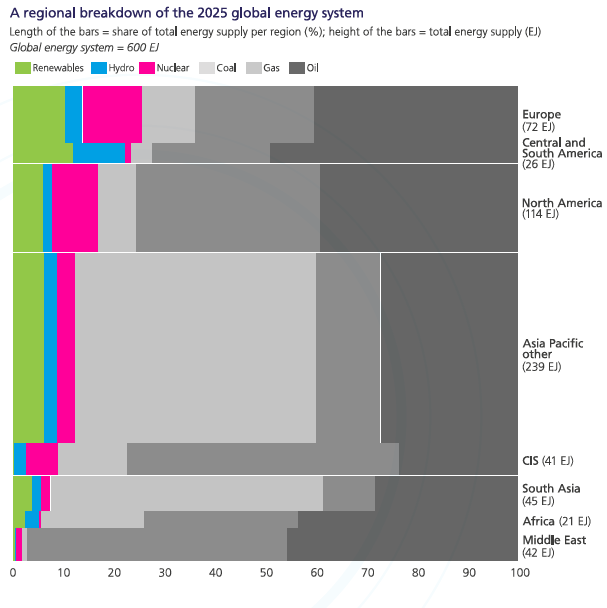
The Statistical Review of World Energy, published annually, provides vital current facts regarding energy use and carbon emissions. Among the diverse figures and tables, two critical patterns emerge. Global energy supply amounts to around 600 exajoules (quintillion joules), with energy distribution measured in joules. The height of each region in the chart represents the total energy supply, while horizontal bars indicate the proportion of energy derived from primary sources. Electricity, a means of transmitting and storing energy, is not included in this analysis.
For advocates striving to achieve net-zero carbon emissions, these figures present a stark reality. The vast majority of energy sources are fossil fuels, as indicated by the gray bars. To achieve a zero-emission goal, a significant transformation is required. When considering energy supply per capita, the disparity becomes even more evident.
African countries, for instance, have an average energy supply of 14 gigajoules per person, while India averages 26 gigajoules. In contrast, European nations and the United States enjoy much higher averages, with 106 and 270 gigajoules per person, respectively.
As lower-income countries strive for economic development, their energy consumption is expected to surge dramatically, potentially tripling or even more. To meet this growing demand, these nations will require substantial increases in energy consumption. Recent data on global carbon emissions from energy in 2025 reveals that the United States contributes 13.3%, while European nations account for 9.9%.
However, the Asia Pacific region dominates this aspect, contributing 53.4% of global carbon emissions from energy. Within this region, China accounts for 31.3% of all global carbon emissions, followed by India at 8.3%, both of which have been experiencing increasing trends. The growth rates in the Asia Pacific region have been at an average annual rate of 2%, with China at 2.1% and India at 3.4% over the past decade.
While efforts in the US and Europe may have a modest direct impact on reducing future global carbon emissions, their influence will be more substantial in facilitating the development of non-carbon and low-carbon energy sources. These countries can play a crucial role in providing the necessary technologies and capital for a vast expansion of cleaner energy options, particularly in lower-income countries and the Asia Pacific region.
Written by urgent.news from Conversable Economist's reporting — not their text. Machine-written — may contain errors; check the original before relying on it.