Observability 2.0: Why DevOps Teams Are Moving From Monitoring to Intelligent System Understanding
For a long time, monitoring just meant staring at dashboards and waiting for something to flash red. Engineers tracked things like CPU usage, memory, response times, error rates, and uptime. If a number crossed a certain line, you’d get an alert. Then, someone dived in to figure out what was wrong. That basic approach isn’t […]
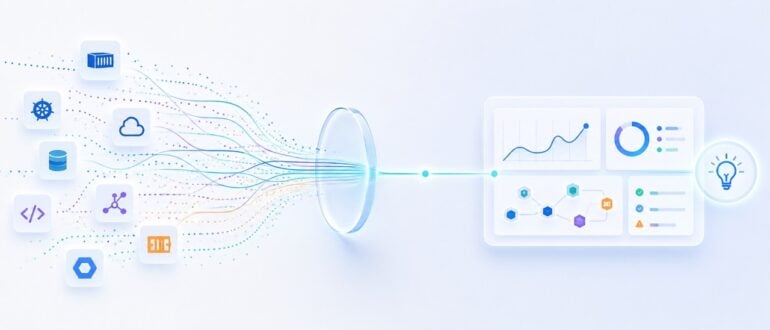
The current state of DevOps is shifting away from traditional monitoring and towards a more comprehensive approach known as Observability 2.0. This is because today's systems are far more complex, with apps running across multiple containers, Kubernetes clusters, cloud services, databases, APIs, and other third-party services. A simple user request can pass through dozens of different components before completing.
Traditional monitoring essentially just involves keeping an eye on dashboards and waiting for something to flash red. Engineers would track metrics like CPU usage, memory, response times, error rates, and uptime. An alert would be generated if any metric crossed a certain threshold, and then an engineer would dive in to investigate the issue. While this was functional, it falls short in today's complicated environment.
The key challenge is that simply knowing "something broke" isn't enough. You need to understand *why* it happened and what exactly is affected. This is where observability comes in. Monitoring systems simply tell you something is wrong, but they don't provide the full picture of what's actually going on. Observability digs deeper into the system to understand the underlying causes of problems, even those that are unfamiliar or weird.
The three pillars of observability are logs, metrics, and traces. Metrics provide numerical data on the system's behavior, logs record detailed events, and traces follow a request as it flows through different services. These pieces of information are crucial, but their true value lies in connecting the dots and piecing together a comprehensive understanding of what's happening.
However, simply collecting more data isn't the goal. The real value comes from making this data useful. Modern observability systems aim to collect telemetry across all systems, without being tied to a single monitoring tool. The challenge used to be drowning in alerts, with engineers getting overwhelmed by thousands of notifications.
Modern observability should not only fire off alerts, but also help engineers untangle the connected events, services, deployments, dependencies, and infrastructure changes to quickly identify the root cause of issues.
Dashboards will still be used, but there's a shift happening behind them. Modern observability ties together telemetry from all sources, allowing engineers to see not just what's failing, but the broader context. For example, if latency goes up, you can see which service is affected, the recent deployment, downstream dependencies, and exactly where the delay is occurring in a trace. This gives engineers a clearer picture and enables them to focus on the most relevant information.
Artificial intelligence is further accelerating this shift. With the massive amounts of telemetry generated by modern systems, AI can help sift through the data and surface connections or oddities that would take humans hours to detect. AI-powered systems can instantly analyze recent deployments, traces, infrastructure changes, database health, and error patterns to quickly point to likely causes of latency issues. While engineers still make the final decisions, AI can help them start the investigation in the right place.
This is particularly important for AI applications. Traditional apps have predictable failure modes with clear logs and stack traces. AI apps, however, can be much more unpredictable. An AI agent might call multiple models, databases, and external tools without any obvious errors. When the final result is subpar, there aren't clear clues to understand what went wrong.
Therefore, observability becomes even more critical. It's essential to track things like which model was used, how long each call took, how many tokens were processed, which external tools were invoked, and where delays occurred. OpenTelemetry's work in this area is directly relevant, providing the telemetry needed to debug these complex AI problems.
Written by urgent.news from DevOps.com's reporting — not their text. Machine-written — may contain errors; check the original before relying on it.