Measuring Decision Confidence in Business Intelligence and Analytics
Learn why Decision Confidence is the KPI organizations should measure.
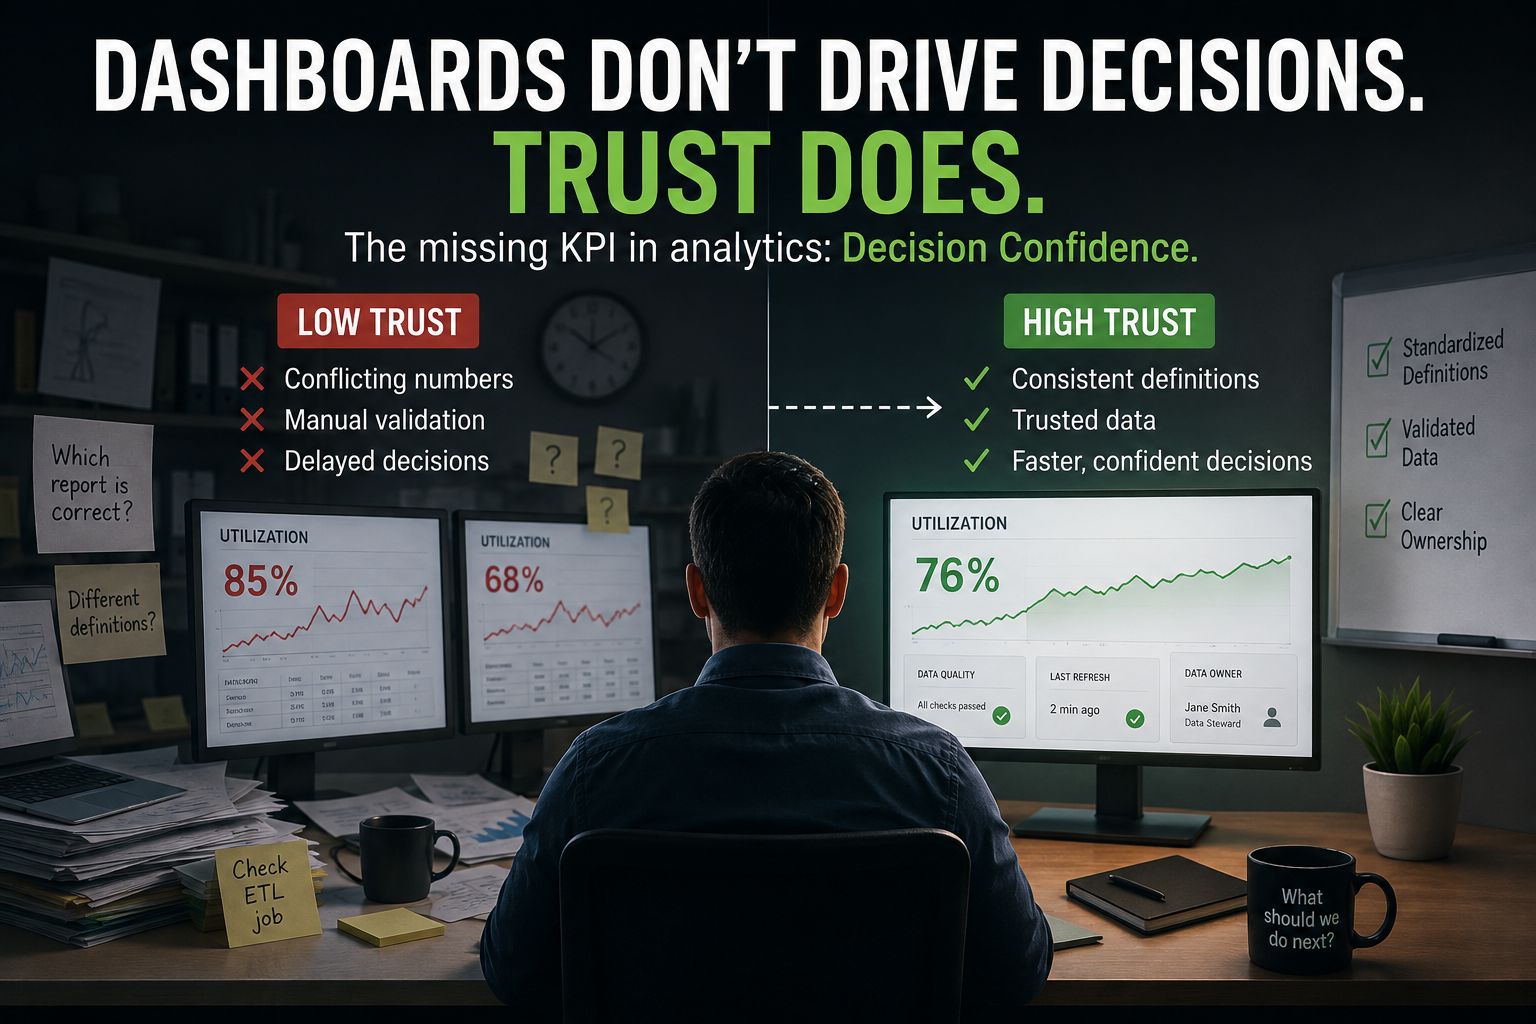
Many companies believe the solution to better decision-making lies in collecting more data, building additional dashboards, and defining more key performance indicators (KPIs). However, after working on Business Intelligence and analytics initiatives across multiple organizations, it becomes clear that uncertain business decisions are not due to a lack of information, but rather a lack of trust in the existing information.
One critical challenge is getting people to trust the data they already possess. This issue is not limited to projects; research indicates that becoming data-driven is as much a cultural challenge as it is a technological one. Organizations can invest heavily in analytics platforms, but if people do not consistently trust and use the information available, they will struggle.
A single meeting changed my perspective on analytics. Operations leaders were reviewing weekly performance metrics when two departments presented reports that measured the same thing using different methods. The discussion shifted from operational performance to debates about SQL logic, data pipelines, and which calculation should be considered correct.
No business decision was made because people questioned the numbers instead of the dashboards. This pattern appeared in various organizations, industries, and analytics platforms, suggesting that the problem is not a shortage of dashboards, but a lack of trust in the data.
The "More Dashboard" trap refers to the common response from business users who ask for better insights: "Let's build another dashboard." While more visibility is expected to lead to better decisions, it often results in inconsistent business logic and confusion. New dashboards introduce opportunities for conflicting business logic unless everyone agrees on what the numbers actually mean.
Organizations spend more time reconciling reports than discussing the decisions those reports should help them make, creating hidden costs not reflected in any KPI dashboard.
Technically correct data does not always equate to trusted data. For instance, when two departments measure completed transactions - one counting them when a customer signs an agreement, and the other only after settlement - both are following legitimate business rules. However, when these reports are placed side by side, confidence in the data diminishes.
These situations create more confusion than software defects ever do, as business users do not see SQL queries, ETL jobs, or transformation logic; they simply see two reports that disagree.
One of the most valuable lessons came from an analytics modernization initiative where the team shifted their focus from asking, "What new dashboard should we build?" to "Why don't people trust the dashboards we already have?" By asking this question, priorities changed. Instead of focusing on new reports and features, the team focused on improving confidence in existing dashboards.
Standardizing business definitions is one of the biggest sources of confusion, stemming from different interpretations of the same metric across dashboards. Centralizing important business calculations into a shared transformation layer significantly reduces these disagreements by ensuring everyone works from the same business definitions.
Validating data before publishing and ensuring dependent datasets are synchronized also enhances trust more effectively than redesigning dashboards. Lastly, making ownership of important business metrics obvious helps users quickly identify who can explain calculations, validate results, or investigate potential issues, reducing the need for questions to bounce between different departments.
Written by urgent.news from HackerNoon's reporting — not their text. Machine-written — may contain errors; check the original before relying on it.