Why Your Trucking Lead Times are Getting Longer
Dive deep into FreightWaves SONAR data as we uncover surprising trends in tender lead times. Discover why lead times are extending, even during typical seasonal lulls, and what this ‘orderly tightness’ means for the freight market. We’ll break down the data for markets like St. Louis and Atlanta, offering crucial insights for shippers and brokers. […] The post Why Your Trucking Lead Times are…
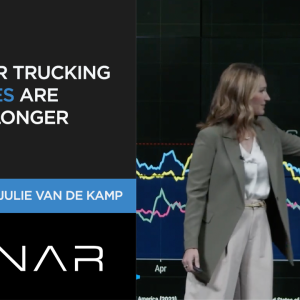
Trucking lead times have been increasing nationally to a three-year high of 3.71 days, according to FreightWaves Sonar data. This rise occurred even during August, a month when lead times typically decrease. Craig Fuller, analyzing the Sonar Truckload Lead Time Index, identified three factors contributing to this trend: advanced shipping planning tools by shippers, a return to contract freight with longer natural lead times, and inventory holders not feeling the urgency to tender loads immediately.
While the national average masks regional differences, St. Louis has a tender lead time of 3.42 days, significantly lower than the West Texas market's 7.53 days due to oil patch logistics. Atlanta stands out with outbound volumes up 3.5% and tender rejections up only 2%, allowing carriers more time to reposition equipment and reducing rejection spikes.
The truckload market is currently experiencing "orderly tightness," with contract rates moving higher while spot rates remain near record levels without spiking. This situation offers brokers and shippers practical guidance on tendering loads based on market trends, helping them manage costs and risks effectively.
Written by urgent.news from FreightWaves's reporting — not their text. Machine-written — may contain errors; check the original before relying on it.