Investment: Can a 150-year-old chart predict stock market prices?
From the Handelsblatt archive: A curve from the 19th century predicts market developments with astonishing precision. For 2026, it recommends selling stocks. How reliable this really is.
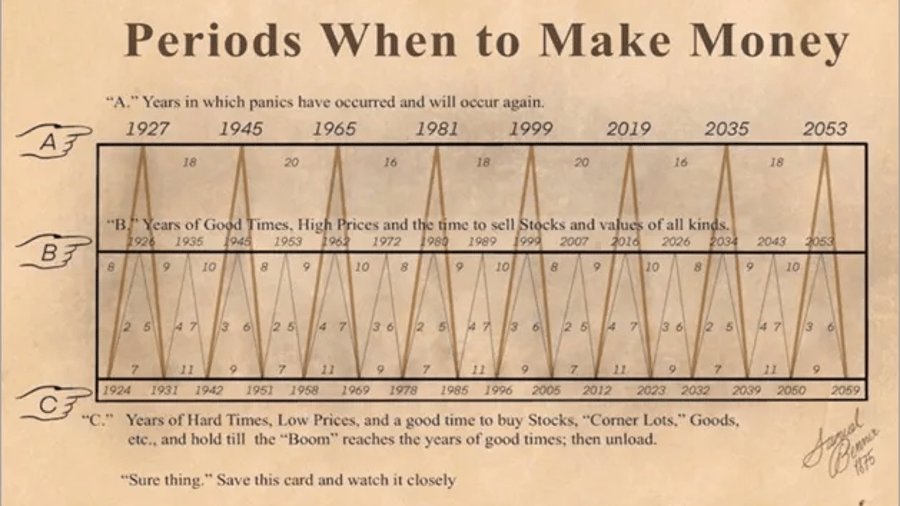
A graph from the 1870s, "Periods when to make Money", claims to predict stock market cycles and has been circulating online, with some enthusiasts arguing it accurately forecast crises such as the 1929 crash and the 2020 coronavirus crash. However, Andreas Hackethal, a professor at the Leibniz Institute for Financial Market Research SAFE in Frankfurt, says the graph's assumptions are based on astrology, not economic reasoning, and has no place in financial markets.
Hackethal argues that the graph's apparent accuracy is due to chance, and that market timing does not work, with only a few key days driving returns, making it better to diversify investments and ride out setbacks.
Written by urgent.news from Handelsblatt's report — not a translation of it. Machine-written — may contain errors; check the original before relying on it.
This story
This is one outlet's version. Read the fullest account.