Dollar weakens as Fed’s Warsh declines to hint at October rate rise
Comments at IMF meetings come after inflation data raised bets of possible back-to-back rate rises
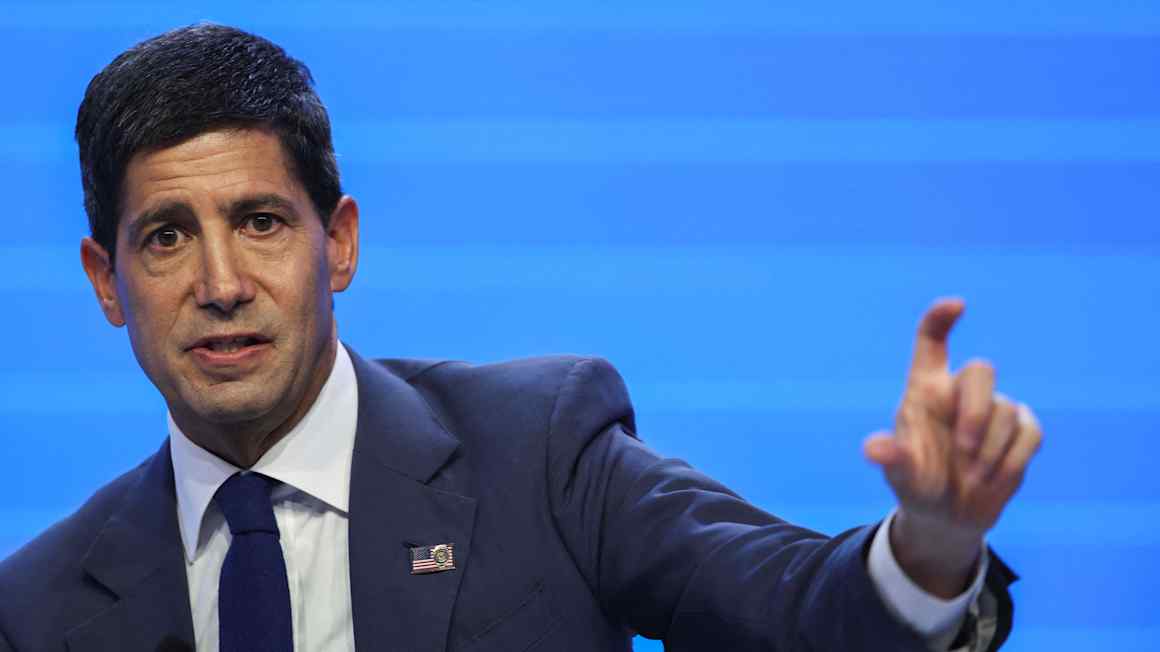
Gold prices surged above $4,150 following a three-day downward trend, driven by a weaker US Dollar and lower US Treasury yields. The Federal Reserve's (Fed) Chair Kevin Warsh's upcoming speech drew attention from traders. In the previous session, US Treasury yields dropped as investors took profits from the technology sector and moved towards bonds amid lower inflation expectations.
The 30-year Treasury yield fell by more than 8 basis points to 5.42%, while the 10-year yield and two-year notes also experienced declines. Reduced bond yields and falling oil prices eased inflation concerns, benefiting the precious metal. Notably, inflation data showed hotter-than-expected increases in the Producer Price Index (PPI) on Thursday.
Despite this, expectations for an October rate hike diminished as traders questioned whether the Fed would raise interest rates twice in a row. Fed Futures indicated at least one more quarter-point increase by year-end. TD Securities noted that commodity traders were covering shorts in precious metals as falling rates supported gold prices.
TD Securities also highlighted the importance of macro discretionary positions, ETF inflows, and central bank demand in supporting gold. Fed Chair Hammack's speech conveyed a moderately hawkish tone, with a speechtracker score of 7.2/10, slightly lower than the historical average of 7.6/10. Hammack's emphasis on the challenges faced by low-income Americans, persistent input cost pressures, and the risk of entrenched inflationary thinking suggested a potential openness to more aggressive policy if price expectations rise.
The FXS Fed Sentiment Index decreased by 0.25 points to 127.92, indicating a minor decline in hawkishness compared to recent readings. However, the index remained well above the neutral 100 threshold, confirming that Fed communication was still predominantly hawkish. In the daily chart, XAU/USD exhibited a bearish near-term bias, trading below the 20-day Bollinger middle band and the 100-day moving average.
The price was closer to the Bollinger lower band than the upper one, with the Relative Strength Index (14) hovering below the mid-50s zone, suggesting limited upward momentum. On the upside, resistance lay at the Bollinger middle band around $4,200, followed by the 100-day moving average of $4,245, and the Bollinger upper band near $4,370. On the downside, the 20-day Bollinger lower band at $4,035 represented the first key support level.
Written by urgent.news from FXStreet's reporting — not their text. Machine-written — may contain errors; check the original before relying on it.
This story
This is one outlet's version. Read the fullest account.