Geldanlage: Kann eine 150 Jahre alte Grafik die Börsenkurse vorhersagen?
Aus dem Handelsblatt-Archiv: Eine Kurve aus dem 19. Jahrhundert sagt erstaunlich präzise die Entwicklung der Märkte voraus. Für 2026 empfiehlt sie, Aktien zu verkaufen. Wie verlässlich das wirklich ist.
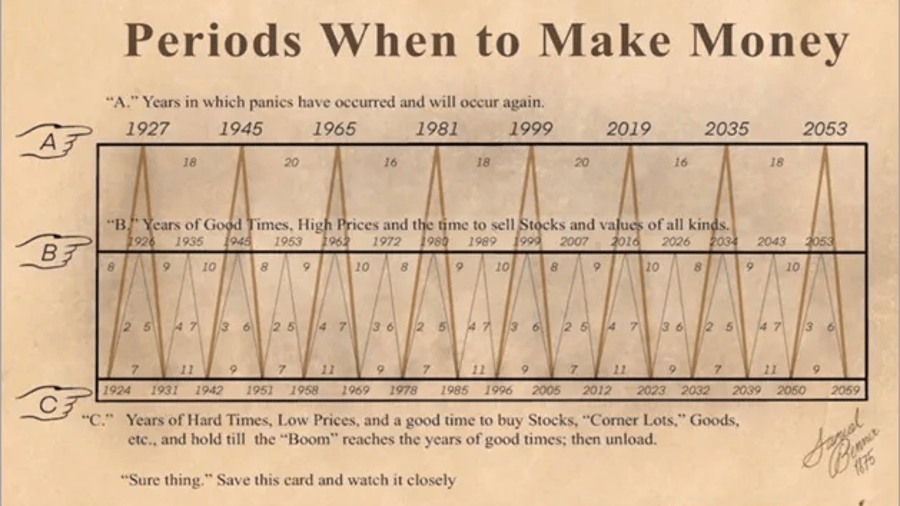
A 150-year-old chart claiming to predict stock market trends has garnered attention, yet its accuracy is questionable. Professor Andreas Hackethal from Frankfurt's Leibniz Institute for Financial Market Research SAFE examined the chart and explained the underlying desire of market participants to find long-term patterns in the randomness of stock movements.
However, the chart's assumptions were based on astrological constellations rather than economic reasoning, which he deemed irrelevant to market dynamics. The chart's origins are unclear, with some sources suggesting it was based on the predictions of a pig farmer, Samuel Bennet, who originally aimed to forecast pig and corn price developments until the end of the century.
Other sources attribute it to George Tritch, who extended the predictions until 2059 and added the astrological component. Despite its age, the chart still draws attention for its surprisingly accurate predictions, such as advising to sell assets in 1927 (before the 1929 stock market crash), 1999 (before the Dotcom bubble burst), 2007 (before the 2008 financial crisis), and 2019 (before the COVID-19 shock).
Some financial bloggers claim the chart has a 90% accuracy rate in its predictions. The chart continues to circulate on social media, YouTube videos, and blogs, with many investors considering its relevance. However, Hackethal suggests that the chart's remarkable accuracy is due to pure probability rather than genuine analysis. He explains that if 100 people were asked to predict stock market trends a century ago, it is likely that one of them would have been relatively accurate.
The chart's predictions that did not come true have long been forgotten, but this does not guarantee future success. The financial market is far too complex for simple patterns in long-term price developments, as various factors influence market behavior, including technological breakthroughs, weather conditions, and major sporting events.
Hackethal emphasizes that the market is too complex to follow simple patterns for long-term price trends, as discovering such patterns would render them obsolete as investors would already buy or sell in anticipation. The real lesson for investors is that trying to predict market trends is not effective. Only a few can benefit from exceptionally good days in the market and make a significant portion of their returns.
Market timing is not a reliable strategy, as missing the top ten days can lead to losses in most years. Instead, Hackethal recommends two fundamental principles for successful investing: diversifying investments to spread risk and staying the course during market downturns.
Written by urgent.news from Handelsblatt's reporting — not their text. Machine-written — may contain errors; check the original before relying on it.