The Stock Market Just Did Something for the 2nd Time in 145 Years, and History Says What Comes Next
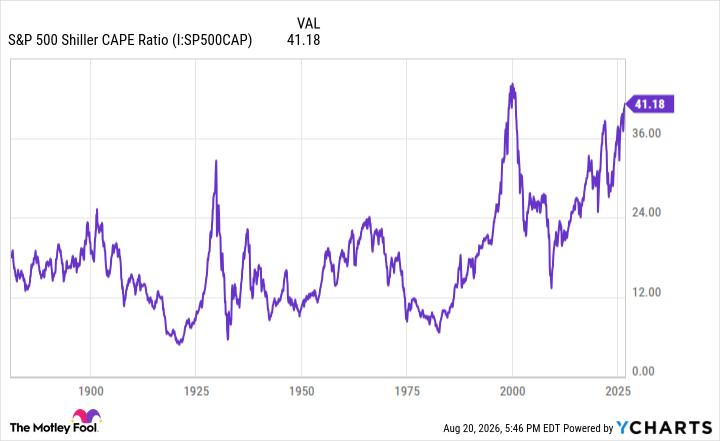
The S&P 500 has recently experienced significant volatility, dropping 2% below its August 13 peak after a 6% gain over the first two weeks of August. The Nasdaq Composite has also shown erratic behavior, up nearly 10% and then down nearly 3% during the same period. An important metric, the Shiller CAPE ratio, crossed above 41 for the second time in 145 years, mirroring the peak of the dot-com bubble in late 1999.
The CAPE ratio, which measures the price of the S&P 500 relative to inflation-adjusted earnings over the past decade, is considered a valuable gauge of market valuation. A ratio above 41 suggests the market is extremely expensive. Analysts caution against over-relying on any single metric, citing factors such as the increasing global nature of U.S. companies and changes in accounting practices that can distort earnings.
Despite these caveats, many view the current market as highly pricey, with potential for future corrections, though predicting the timing remains uncertain. Experts advise maintaining a diversified portfolio of quality businesses to weather such market turbulence.
Written by urgent.news from Yahoo Finance's reporting — not their text. Machine-written — may contain errors; check the original before relying on it.