A case for a bitcoin surge to $76,000 may be building beneath the boring price action, but there's a caveat
Bitcoin's chart is quietly tracing out a bullish setup technical analysts watch closely. But it isn't confirmed, and one key level will decide if it plays out.
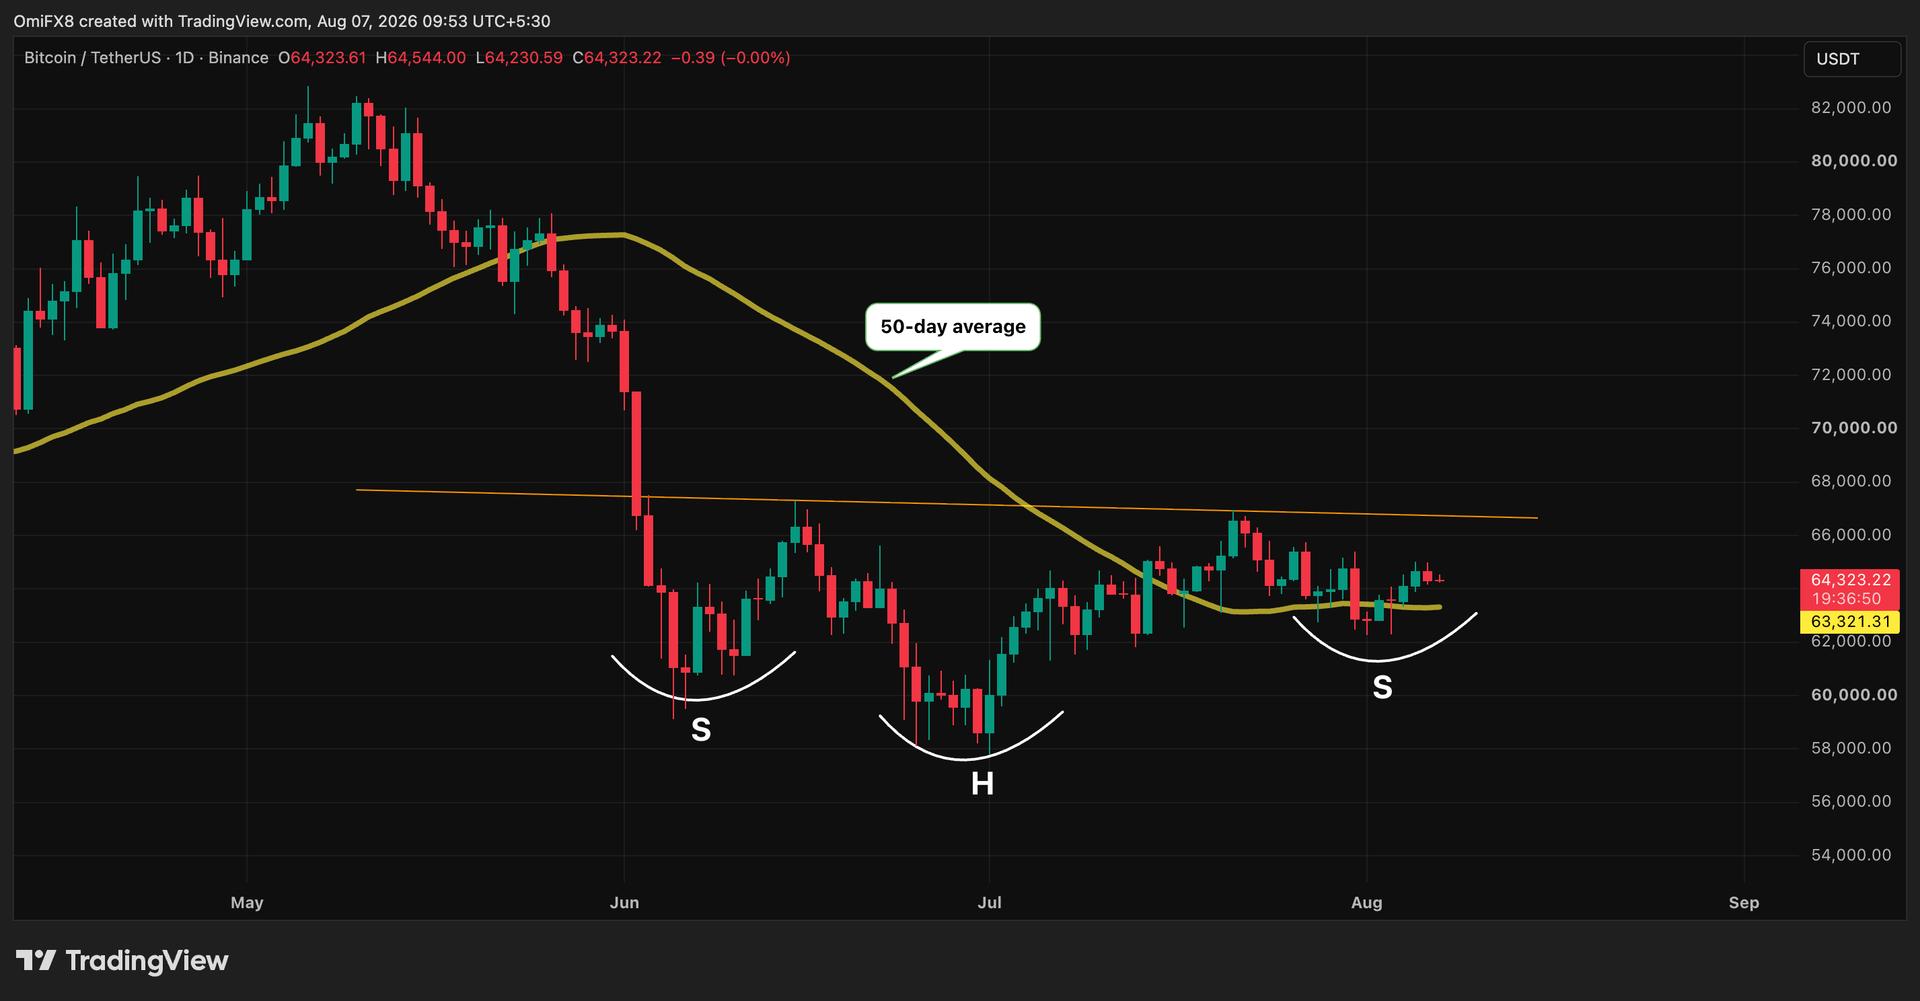
Bitcoin's recent price action has been lackluster, potentially prompting traders to seek more dynamic opportunities. However, a closer examination using technical analysis reveals a potential bullish scenario that could push the cryptocurrency to $76,000. This pattern, the inverse head-and-shoulders (H&S) setup, is typically indicative of a trend reversal from a downtrend to an uptrend.
Comprised of three troughs separated by temporary price recoveries, the middle trough represents the peak of bearishness, whereas the shallower trough that follows signals the weakness of the downtrend. A completed bullish pattern emerges once the price surpasses the line connecting these transitions, known as the neckline. The inverse H&S is presently visible on Bitcoin's daily chart, with a low near $60,000 in early June constituting the left shoulder, a more pronounced trough near $57,700 in late June or early July marking the head, and a recent bounce from around $62,500 representing the right shoulder.
Upon connecting these bounce highs, a neckline emerges, situated at approximately $66,800. Should the price successfully break and maintain above this level, technical analysts would consider it a bullish confirmation, with a projected target near $76,000. This projected target is calculated by adding the pattern's depth to the breakout point.
While some chartists may argue that this setup does not strictly adhere to textbook rules, the inverse H&S is generally regarded as a dependable bullish reversal setup among analysts. Renowned chart pattern expert Thomas Bulkowski ranks it 13th out of 39 for performance, boasting an 11% break-even failure rate. His extensive analysis of thousands of charts from traditional equity markets indicates that 71% of these patterns achieve their target price, with a 65% rate of retracing to test the neckline beforehand.
However, it is crucial to note that an inverse H&S pattern is still under development and not yet confirmed. It is merely one possible scenario, not a guarantee. The success of this pattern relies on the price hitting and holding above the neckline. Currently, there is a potential downside risk to consider. The Clarity Act, which could provide regulatory support, has been losing momentum, diminishing a hoped-for catalyst for bullish sentiment.
As such, vigilance for fresh weakness remains essential even as the chart displays a bullish setup. A key level to monitor for potential downside pressure is the 50-day simple moving average, currently near $63,321. A decisive break below this average would serve as an early indicator that the bullish setup may be losing momentum rather than building towards a breakout.
Written by urgent.news from CoinDesk's reporting — not their text. Machine-written — may contain errors; check the original before relying on it.