Bidirectional Sync Between Radar Chart Vertex Dragging and Sliders
📝 Originally published (in Japanese) at forge.workstyle.tech . Introduction to Interactive Radar Charts In a UI for adjusting multi-dimensional parameters, radar charts (also known as spider graphs) are very intuitive. Being able to see the current balance at a glance through the area and shape of an octagon is more intuitive than having eight sliders lined up. However, in many implementations,…
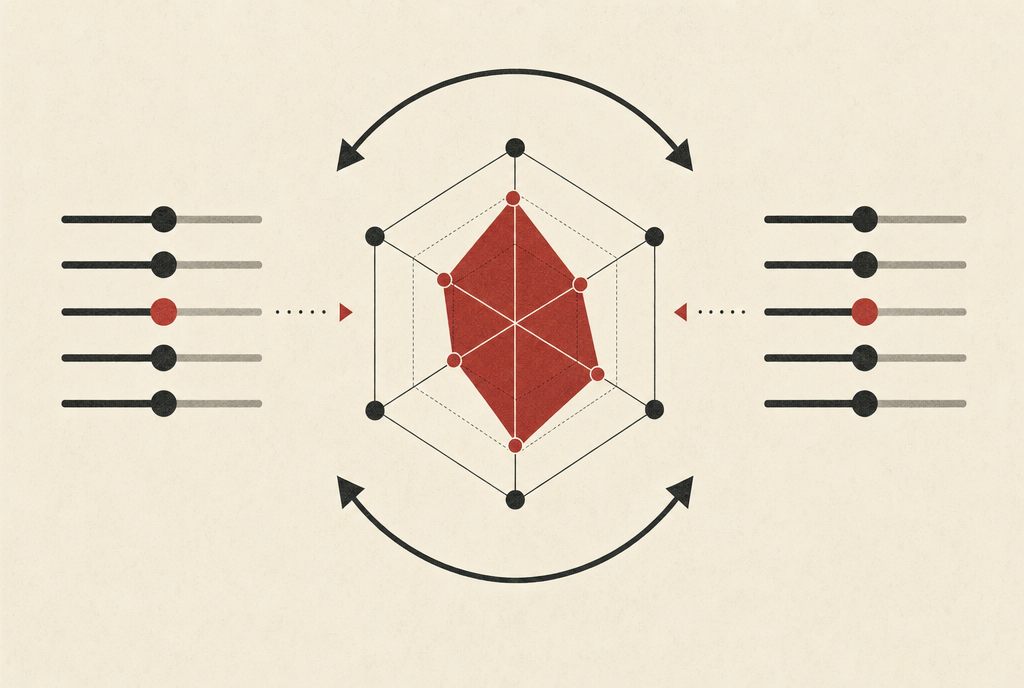
Bidirectional synchronization between radar chart vertex dragging and sliders is crucial for creating an intuitive user experience when adjusting multi-dimensional parameters. In a UI with a radar chart, also known as a spider graph, the current balance can be easily visualized through the octagon's area and shape. This approach is more intuitive than having eight separate sliders.
Traditionally, radar charts have been read-only, with values input through sliders and displayed as results in the chart. However, enabling direct drag of the radar chart's vertices would significantly improve the operation's feel. Moreover, bidirectional synchronization between the sliders and radar chart would allow users to operate from either side, enhancing the overall user experience.
This article outlines the pattern for implementing SVG radar chart vertex drag editing and bidirectional synchronization using React. The key points include coordinate transformation and pointer event handling. The design approach emphasizes having only one state, which serves as the single source of truth for both the radar chart and the sliders. Both components read from this single state and redraw themselves accordingly. When operated, they call the same update function.
To achieve this, the article proposes a forward direction design, where values are converted into vertex coordinates. The axes are arranged at equal angles, with the angle of the i-th axis calculated based on the circle's division into N parts. Values ranging from 0 to 100 are normalized to a 0-1 scale, multiplied by the radius R, and then converted from polar to Cartesian coordinates to determine the vertex positions.
If the value is undefined, it defaults to 50 (the center). The number of axes (n) is obtained from the length of the axes array, allowing the same code to work for different numbers of axes, such as 6 or 8.
The challenging part is the reverse direction, where the "value of that axis" is determined from the pointer's position. This requires two coordinate transformations. Firstly, screen coordinates are converted to SVG coordinates, as SVG has an internal coordinate system with viewBox, and the actual drawing size can change with CSS. The pointer's clientX and clientY values, initially in screen pixels, are divided by the element's rectangle and converted back to the viewBox scale.
Secondly, SVG coordinates are transformed into axis direction values. The user may not always drag exactly along the axis line; they might drag diagonally. To address this, the vector from the center to the pointer is projected onto the direction vector of the axis, resulting in a signed distance (component in the axis direction). Dividing this value by R provides a value ranging from 0 to 1, representing the slider value.
Written by urgent.news from Dev.to's reporting — not their text. Machine-written — may contain errors; check the original before relying on it.